Sources of economic growth in the US, UK, Germany & Japan, 1990-2019
There has been much talk recently about the low growth rate in the UK economy since 2008 and how it must be increased. Often the discussion is about GDP growth, although some commentators also referred to the underlying measure of GDP per capita (or output per capita) as the more relevant metric to look at. GDP and its growth is a composite measure, because it is an outcome of (growth in) the size of the population, the number of people at work and labour productivity (output per hour). GDP growth can be decomposed to its components by a linear approximation. We can look at GDP growth as a result of GDP/capita and population growth or decompose it further into employment growth, growth in the annual workload and labour productivity. To make a comparison, I did this decomposition for four major high-income econonomies below, the US, UK, Germany and Japan.
Population vs productivity growth
We can define GDP as a product of population size (pop) and GDP per person (\(GDPpp\)):
\[GDP = GDPpp \times population \tag{1}\label{eq1}\]Then, the change in GDP from year t to t+1 (\(\Delta GDP\)) can be expressed as:
\[\Delta GDP = (GDPpp_t + \Delta GDPpp) \times (pop_t + \Delta pop) - GDPpp_t \times pop_t = \\ GDPpp_t \times \Delta pop + \Delta GDPpp \times pop_t + \Delta GDPpp \Delta pop \tag{2}\label{eq2}\]Dividing through by \(GDPpp_t \times pop_t\) to calculate the change as a fraction (\(\delta\)) of the base year t:
\[\delta GDP = \delta pop + \delta GDPpp + \delta pop \times \delta GDPpp \approx \delta pop + \delta GDPpp \tag{3}\label{eq3}\]Where we dropped the \(\delta pop \times \delta GDPpp\) as this is a product of fractional terms, therefore quite small. This means that the percentage change in GDP can be approximated as the sum of the percentage change in population size and GDP per capita. In other words we can separate how much of economic growth is due to population growth and how much to an increasing output per capita. While a growing population increases economic output in absolute terms it does not (in itself) increase output per person which is more relevant if we want to discuss whether a country is growing richer as well.
I tested how well this linear decomposition (Eq. \ref{eq3}) can explain GDP growth in four major high-income economies, the US, the UK, Germany and Japan.
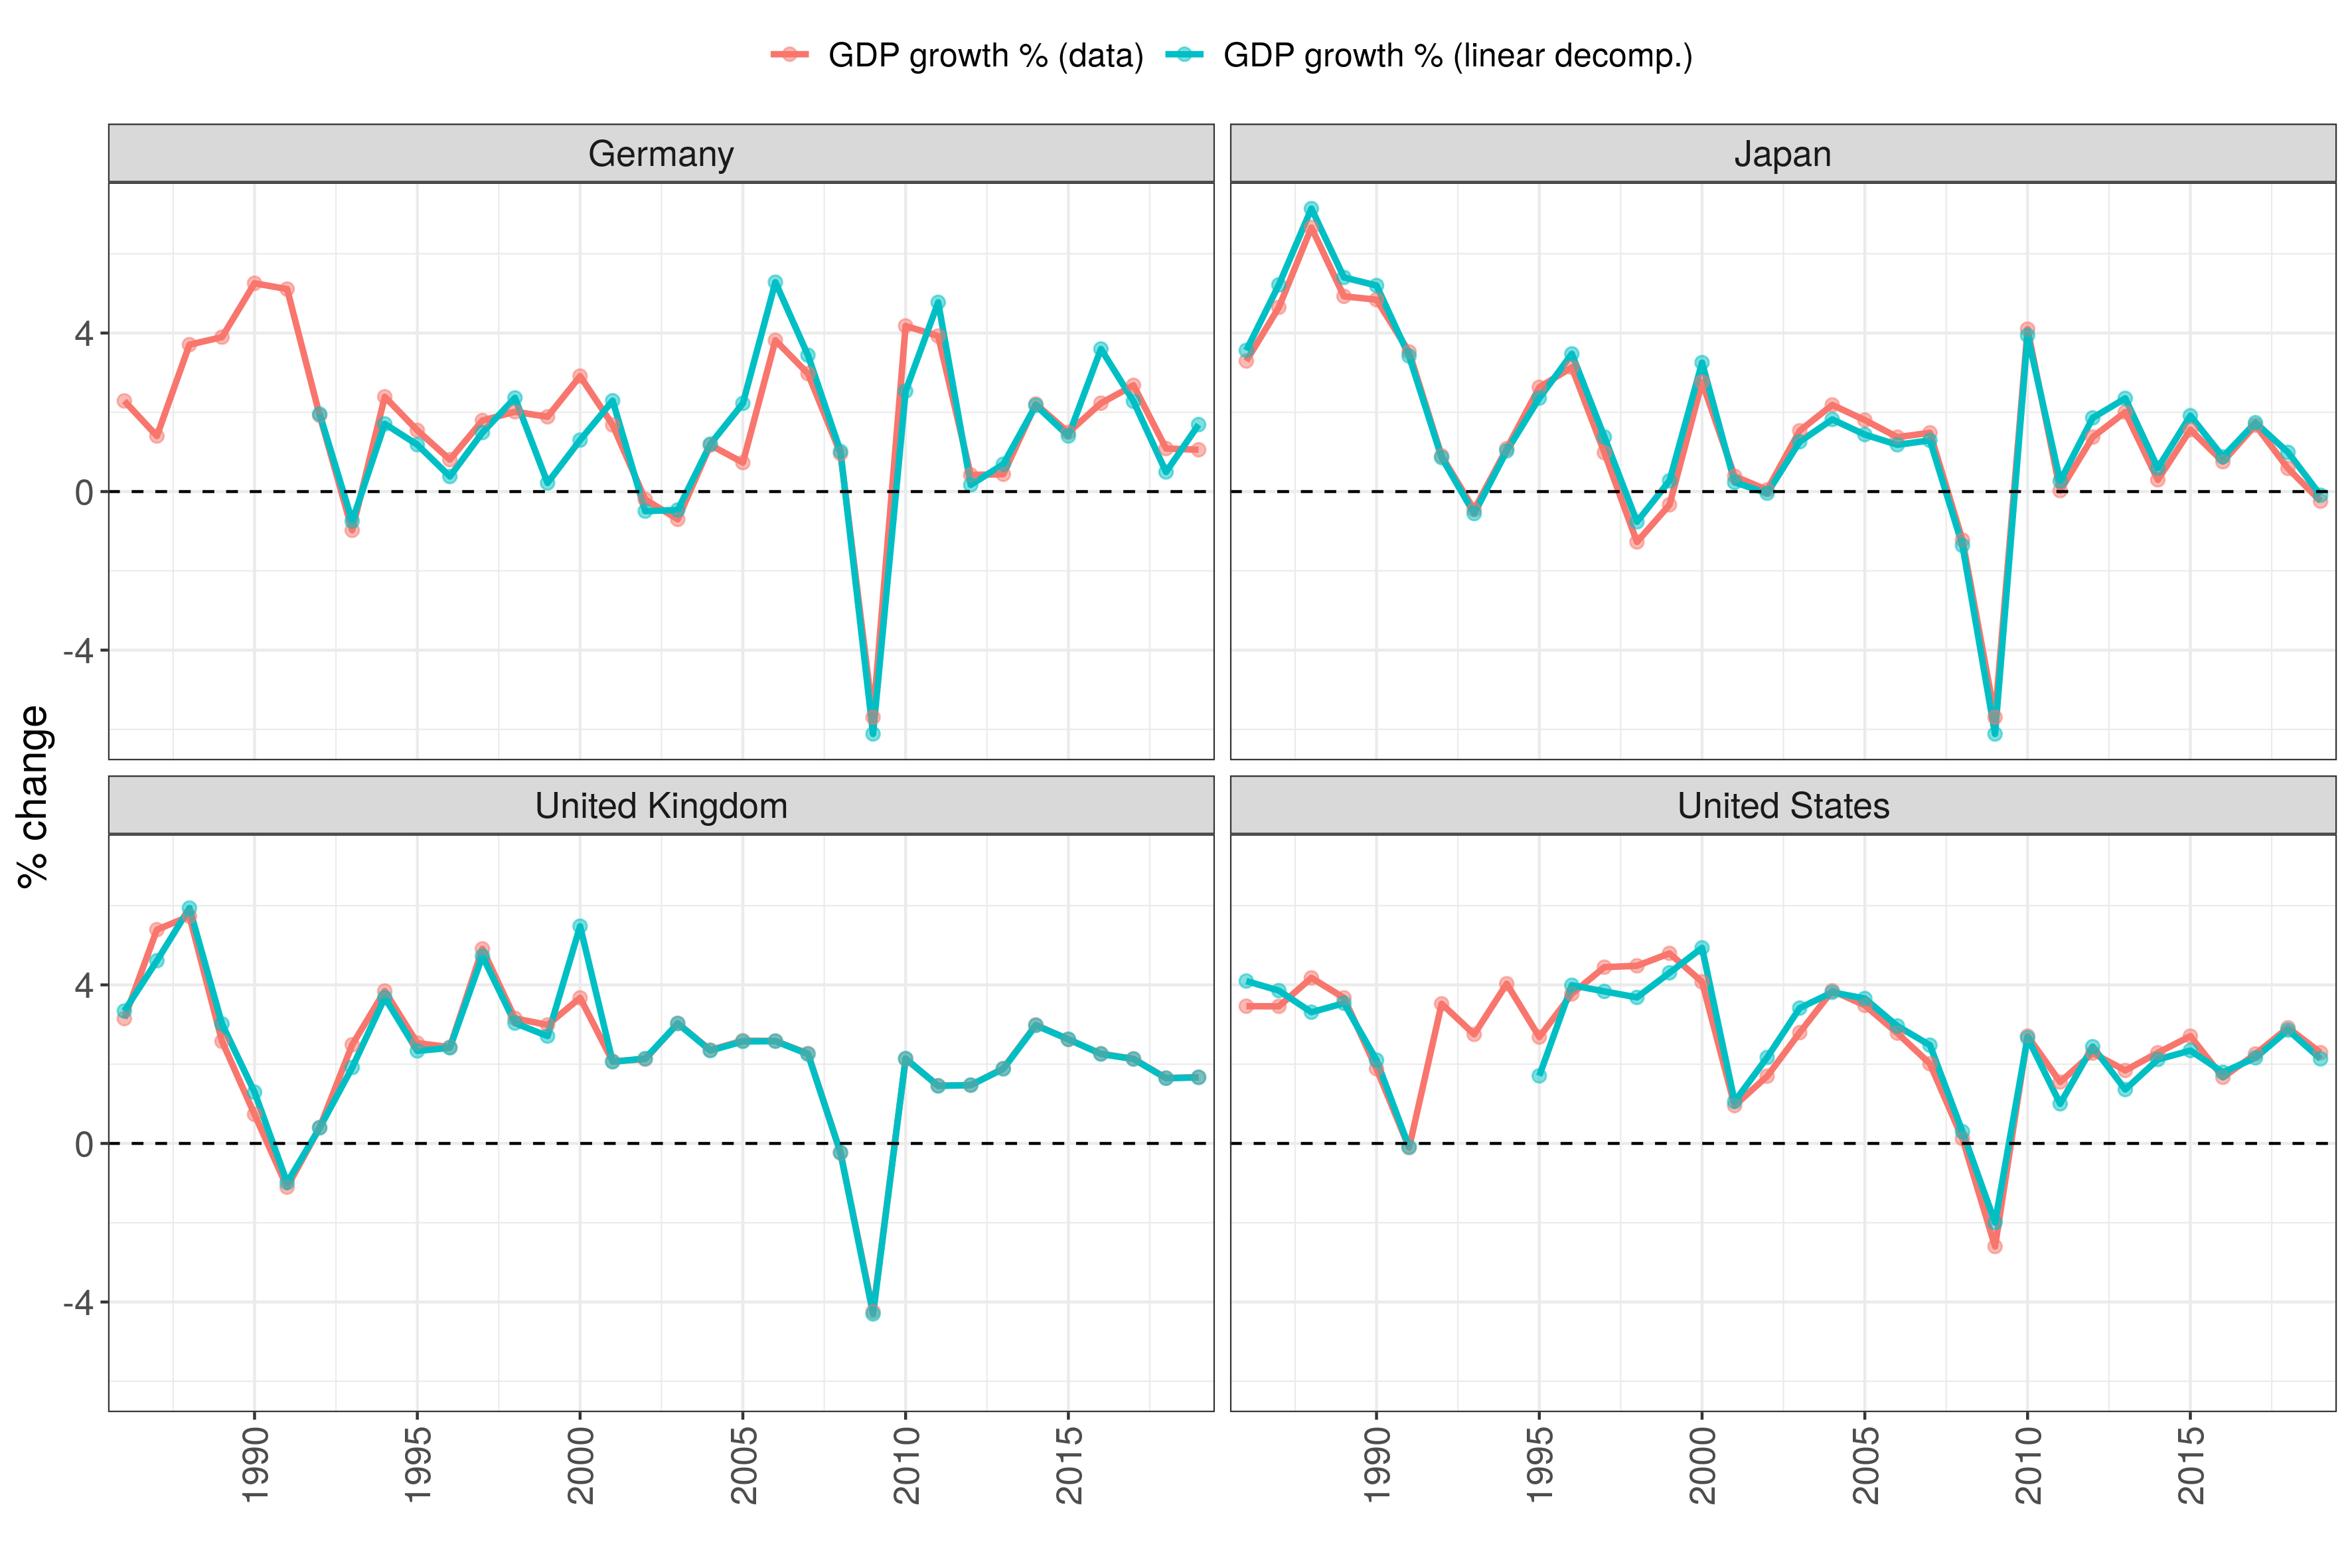
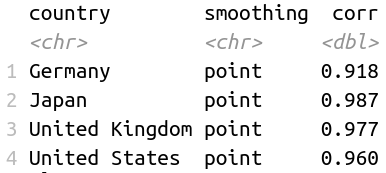
There is good correspondence visually and calculating correlations confirms that this linear decomposition can explain more than 90% of GDP growth data:
We now want to calculate how much of GDP growth can be accounted for by population growth vs per capita output growth in these four countries. I calculated the mean growth rates of GDP, population and GDP per capita for three periods: 1990-2000, 2001-2008 and 2009-2019, corresponding to the three business cycles of the last three decades and leaving out recession years that would distort the calculation.
We can first look at the mean growth rates in absolute terms:
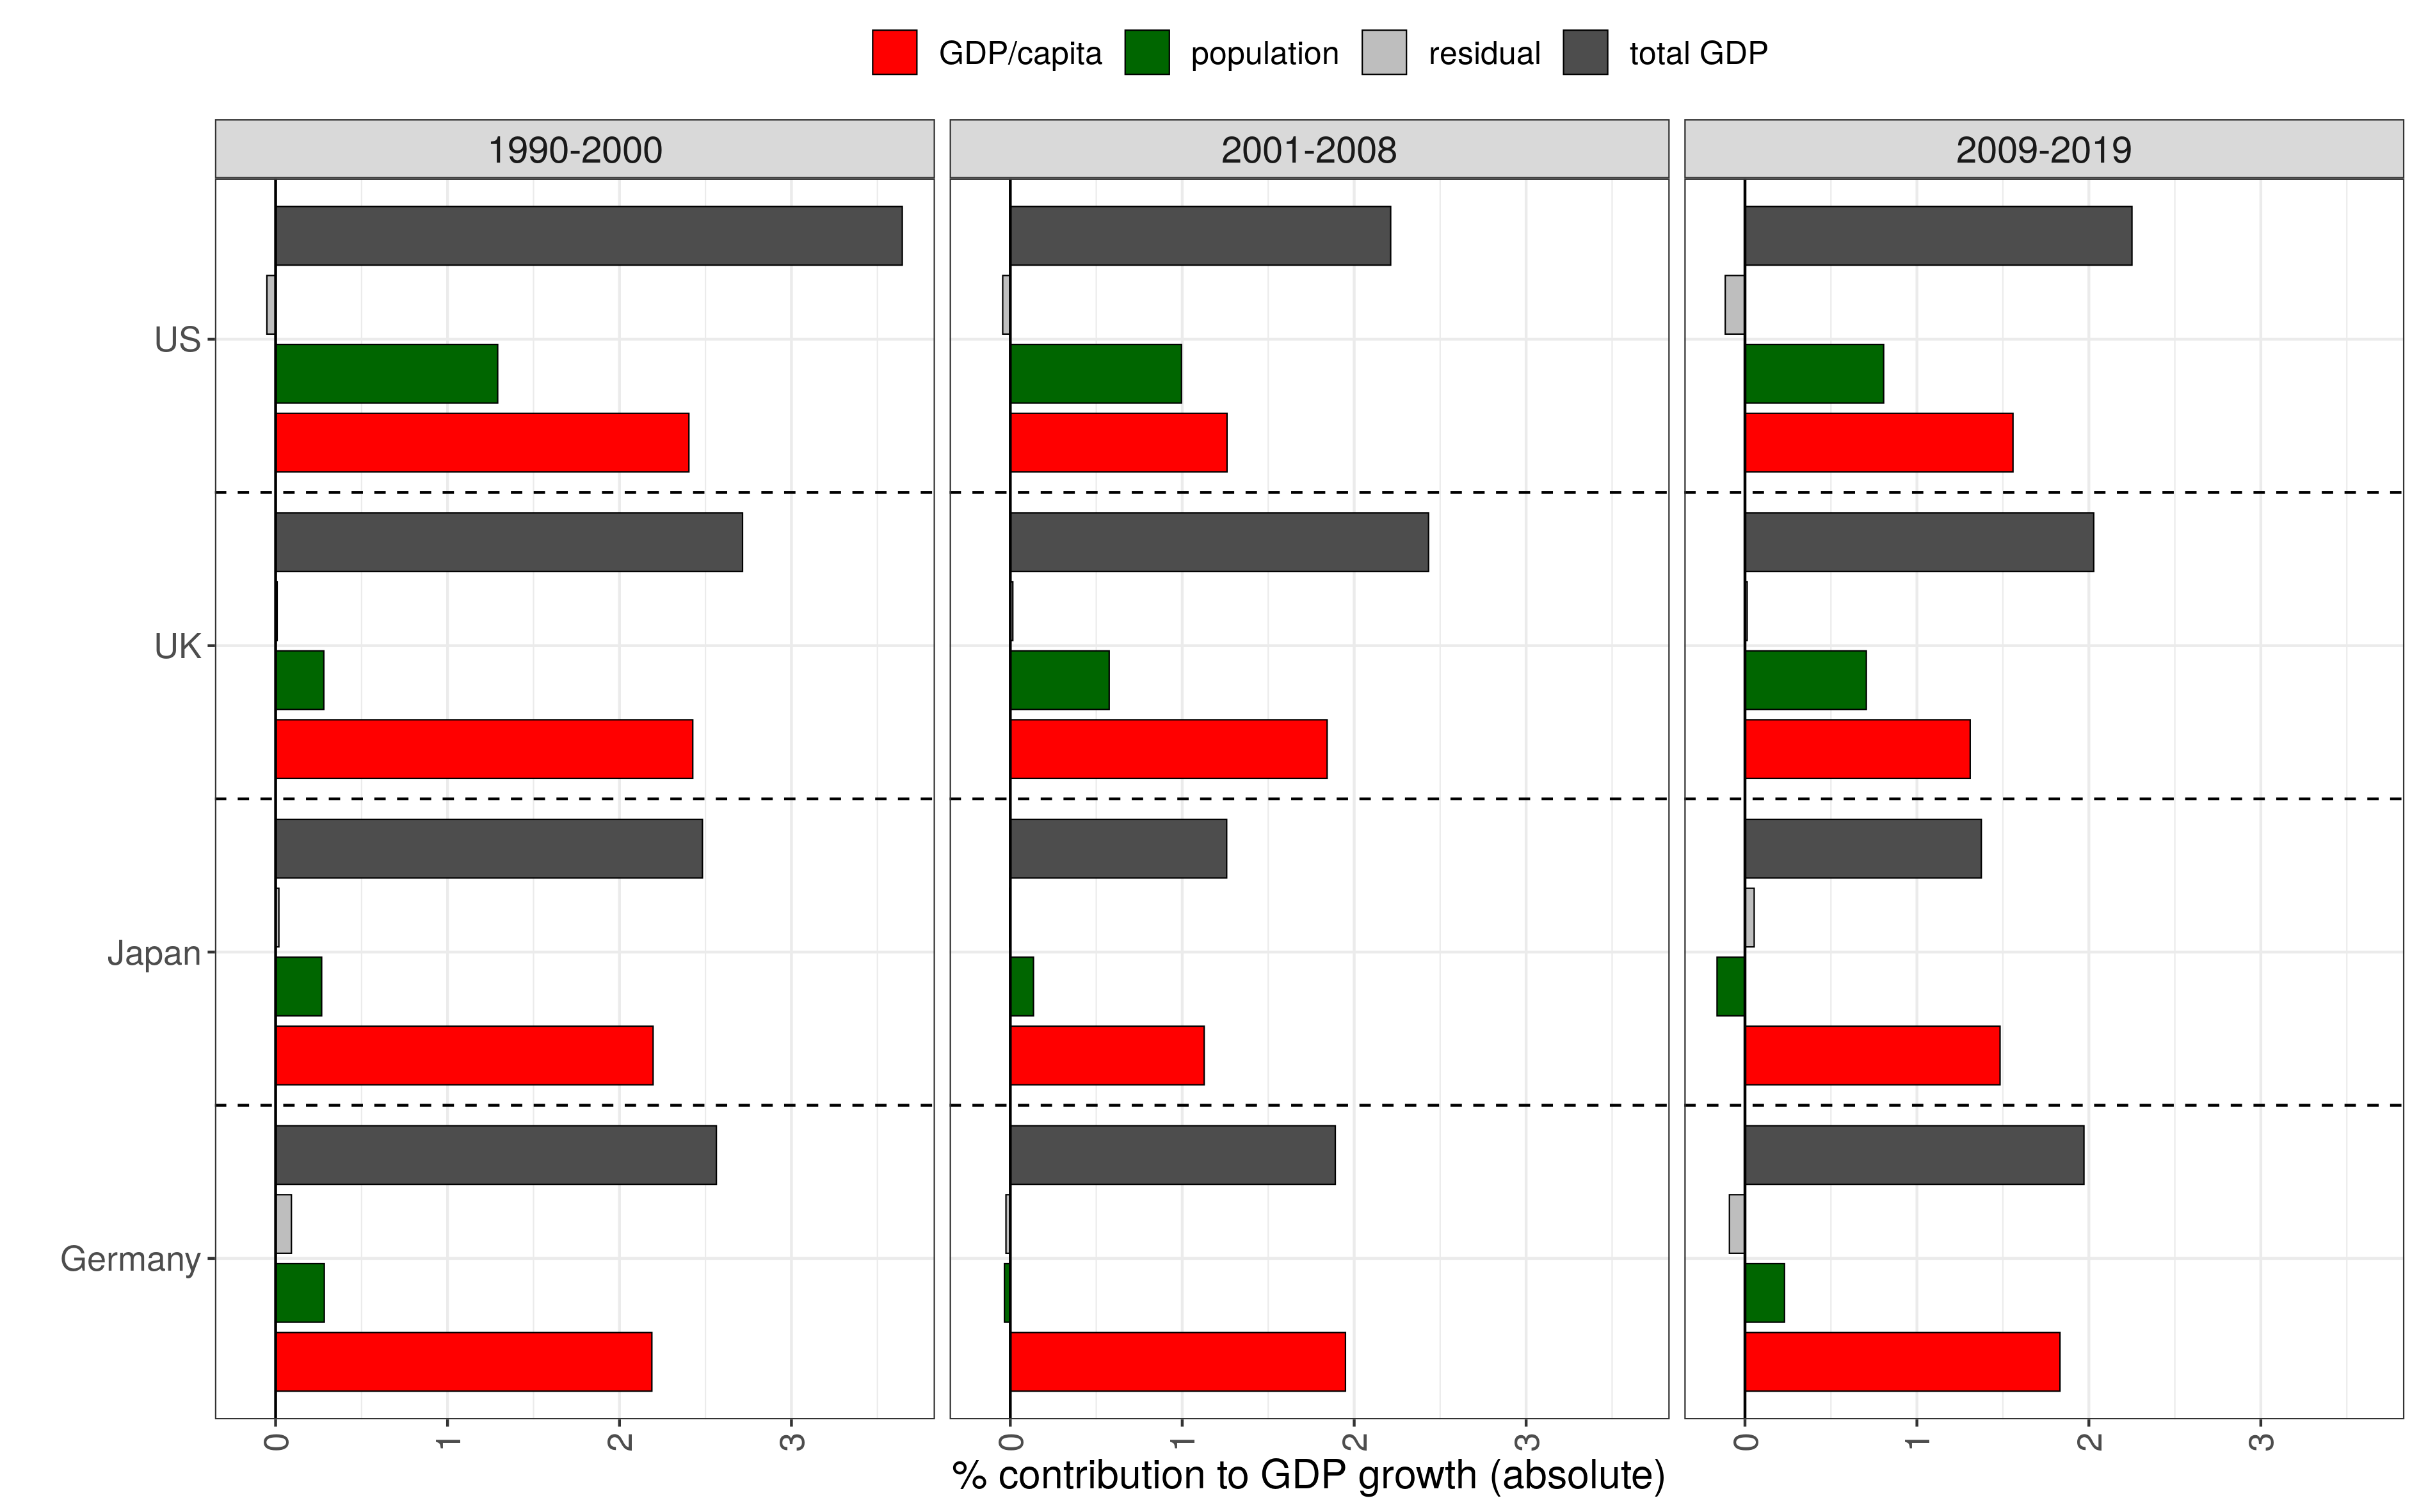
There is a slowdown of GDP growth in all four countries, but the composition of growth also changes for the US and the UK. While for Japan and Germany almost all growth comes from GDP per capita, in the US and the UK population growth also contributes substantially. In the case of the UK the share of GDP growth coming from population growth increased as well.
We can see this better if we plot the average of the ratio of population growth and GDP per capita growth to GDP growth (x100):
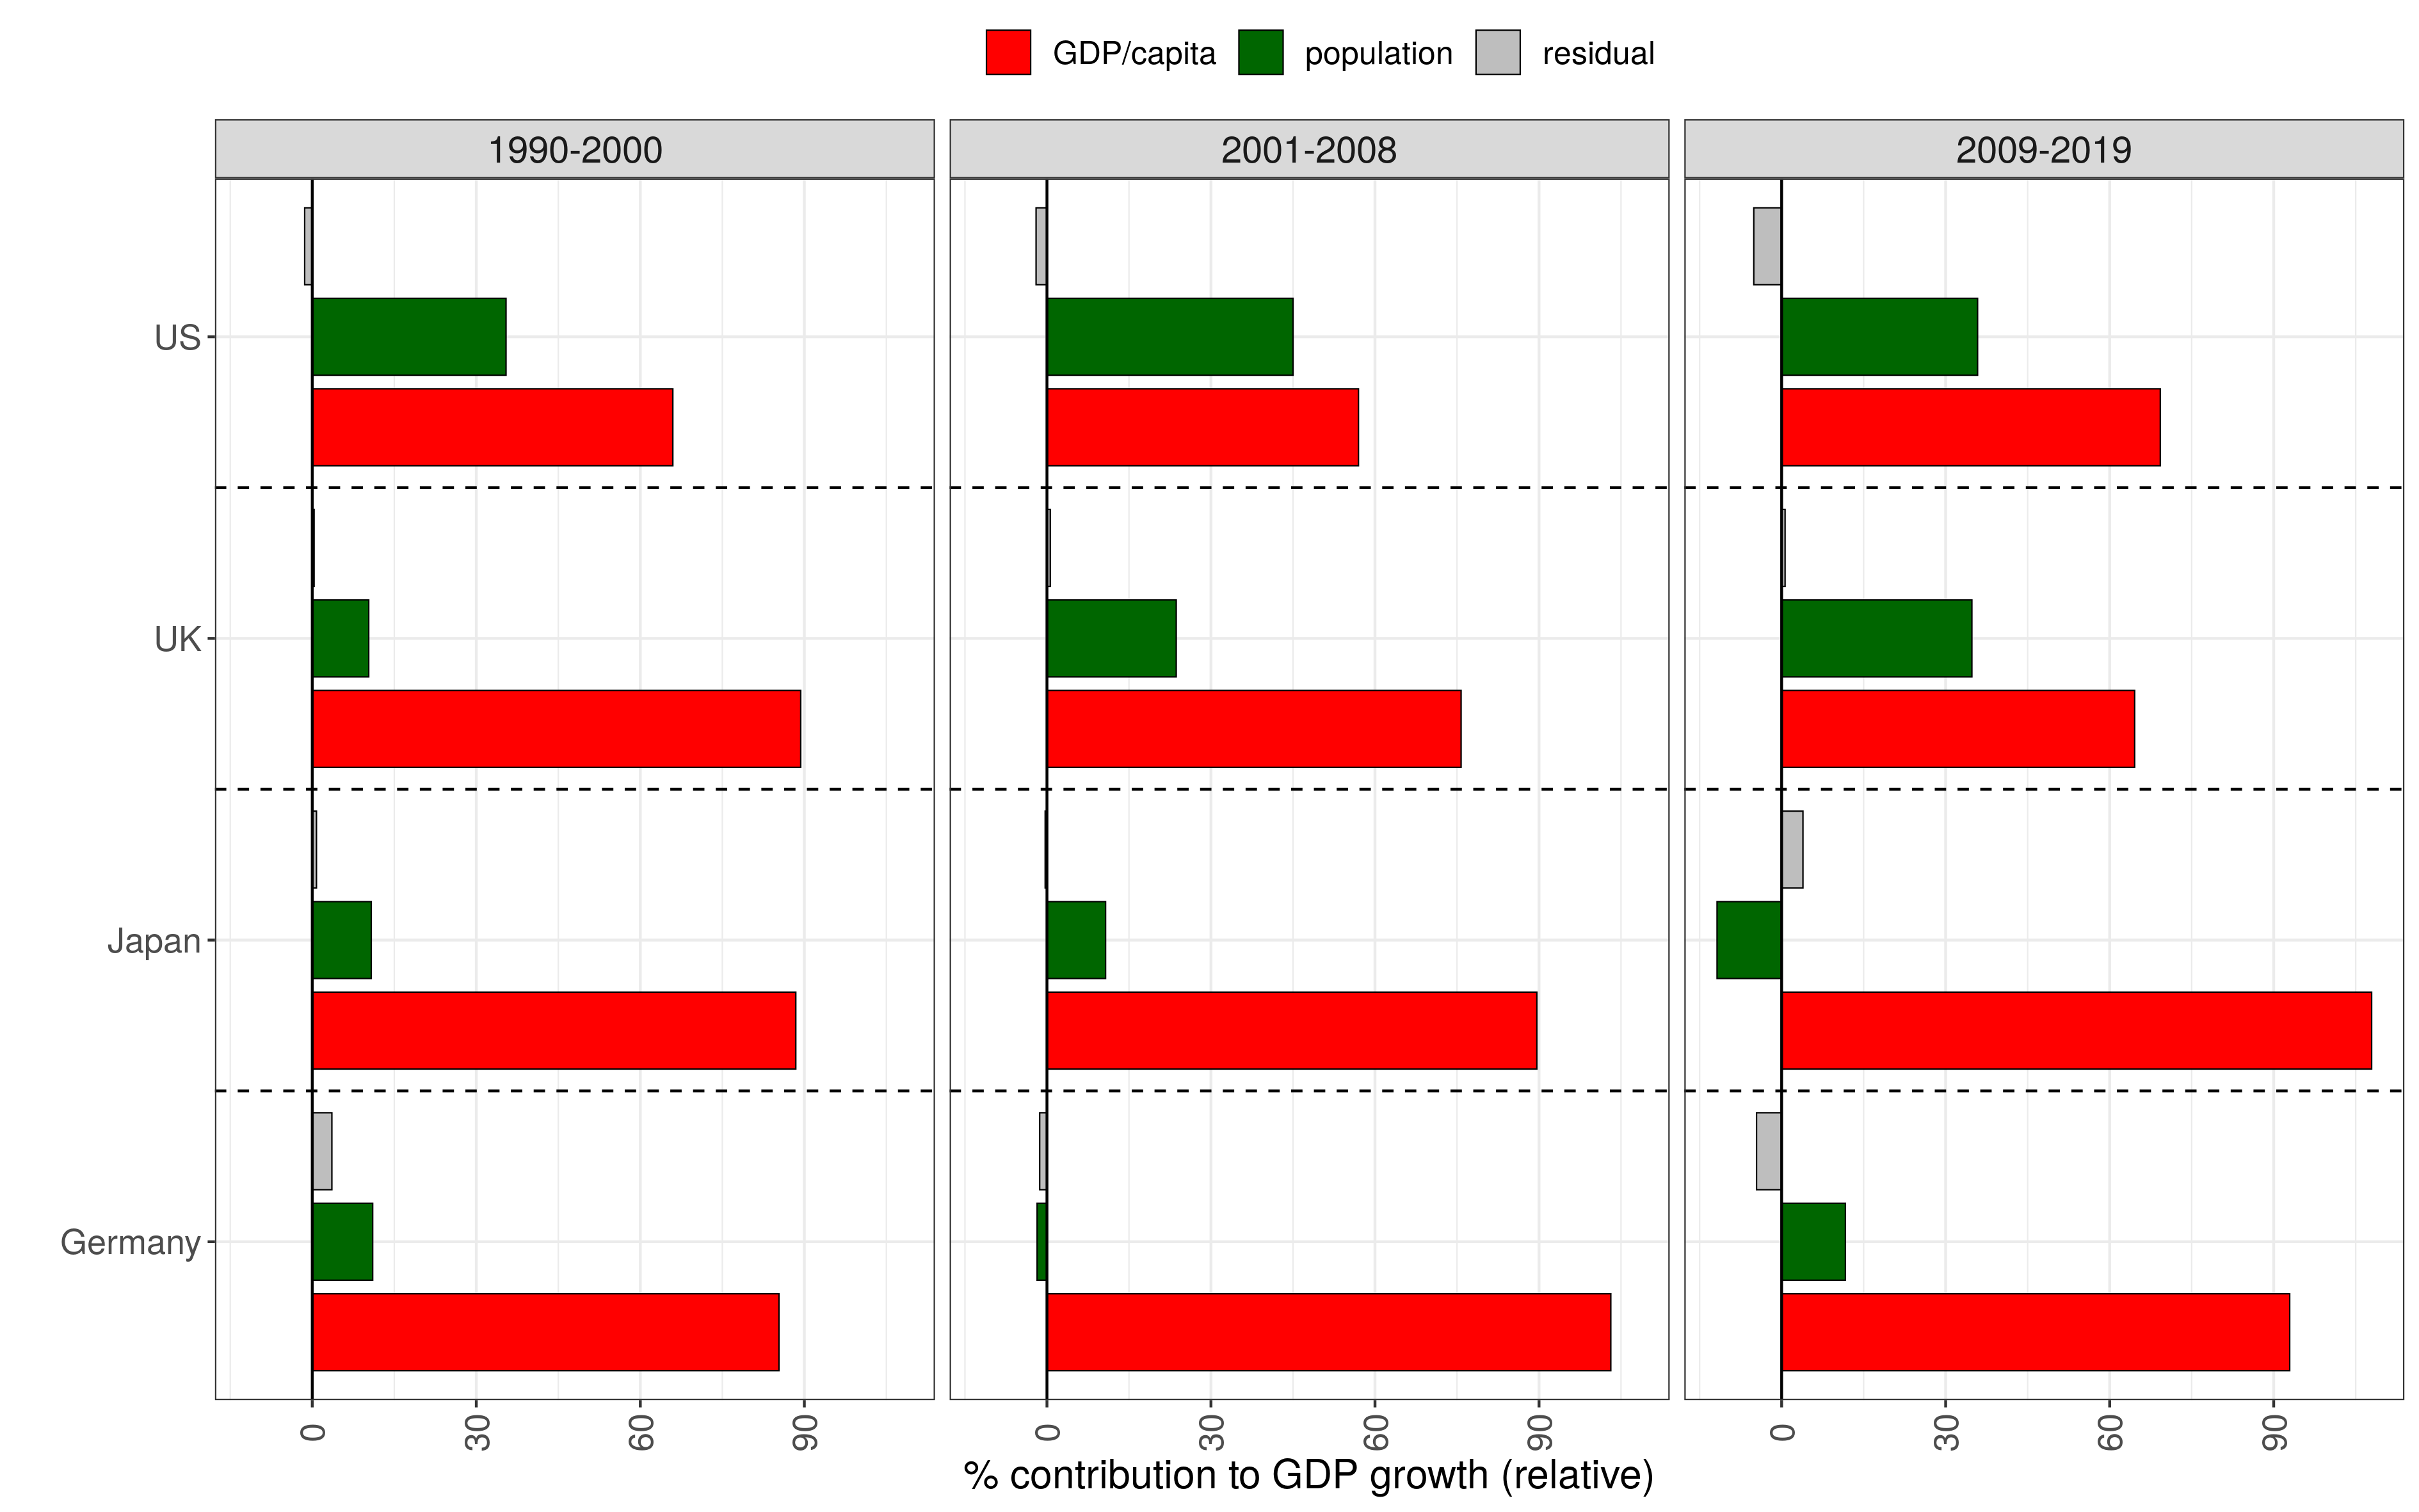
Now we can see more clearly that whereas almost all GDP growth can be explained by increasing GDP/capita in Japan and Germany, in the US 30-40% of GDP growth comes from population growth on average in all three periods. In the UK the share of population growth in economic growth increased substantially, from around 10% to above 30%. In contrast, population growth has been a drag on economic growth in Japan as the population started to shrink recently.
There are two issues with this decomposition. First, GDP per capita is still a composite measure, as it depends on several underlying variables: on the number of people working and output per worker in its numerator but also on population in its denominator. Therefore it could be increasing or decreasing for different reasons. This is particularly relevant for Japan where the population decreased recently. Second, total population is not the direct source of economic growth, as from the point of view of value production it is the working population that is relevant. Therefore we need to decompose GDP growth into its more elementary components.
Employment vs productivity growth
GDP can be described as a product of 1) the number of people at work (employment; E) 2) hours worked per year per worker (AHW) 3) output per hour of work (labour productivity, LP):
\(GDP = employment \times (annual \ working \ hours) \times (output \ per \ hour) = E \times HW \times LP\)
Applying the same logic as in Eq. \ref{eq3} we can derive the fractional change in GDP, again dropping second and third order terms: \(\delta GDP \approx \delta E + \delta AHW + \delta LP \tag{4}\label{eq4}\)
In other words, we are now asking how much of GDP growth came from:
- more people working
- people working more
- labour becoming more productive
First, we calculate the average growth rates for GDP and its three components:
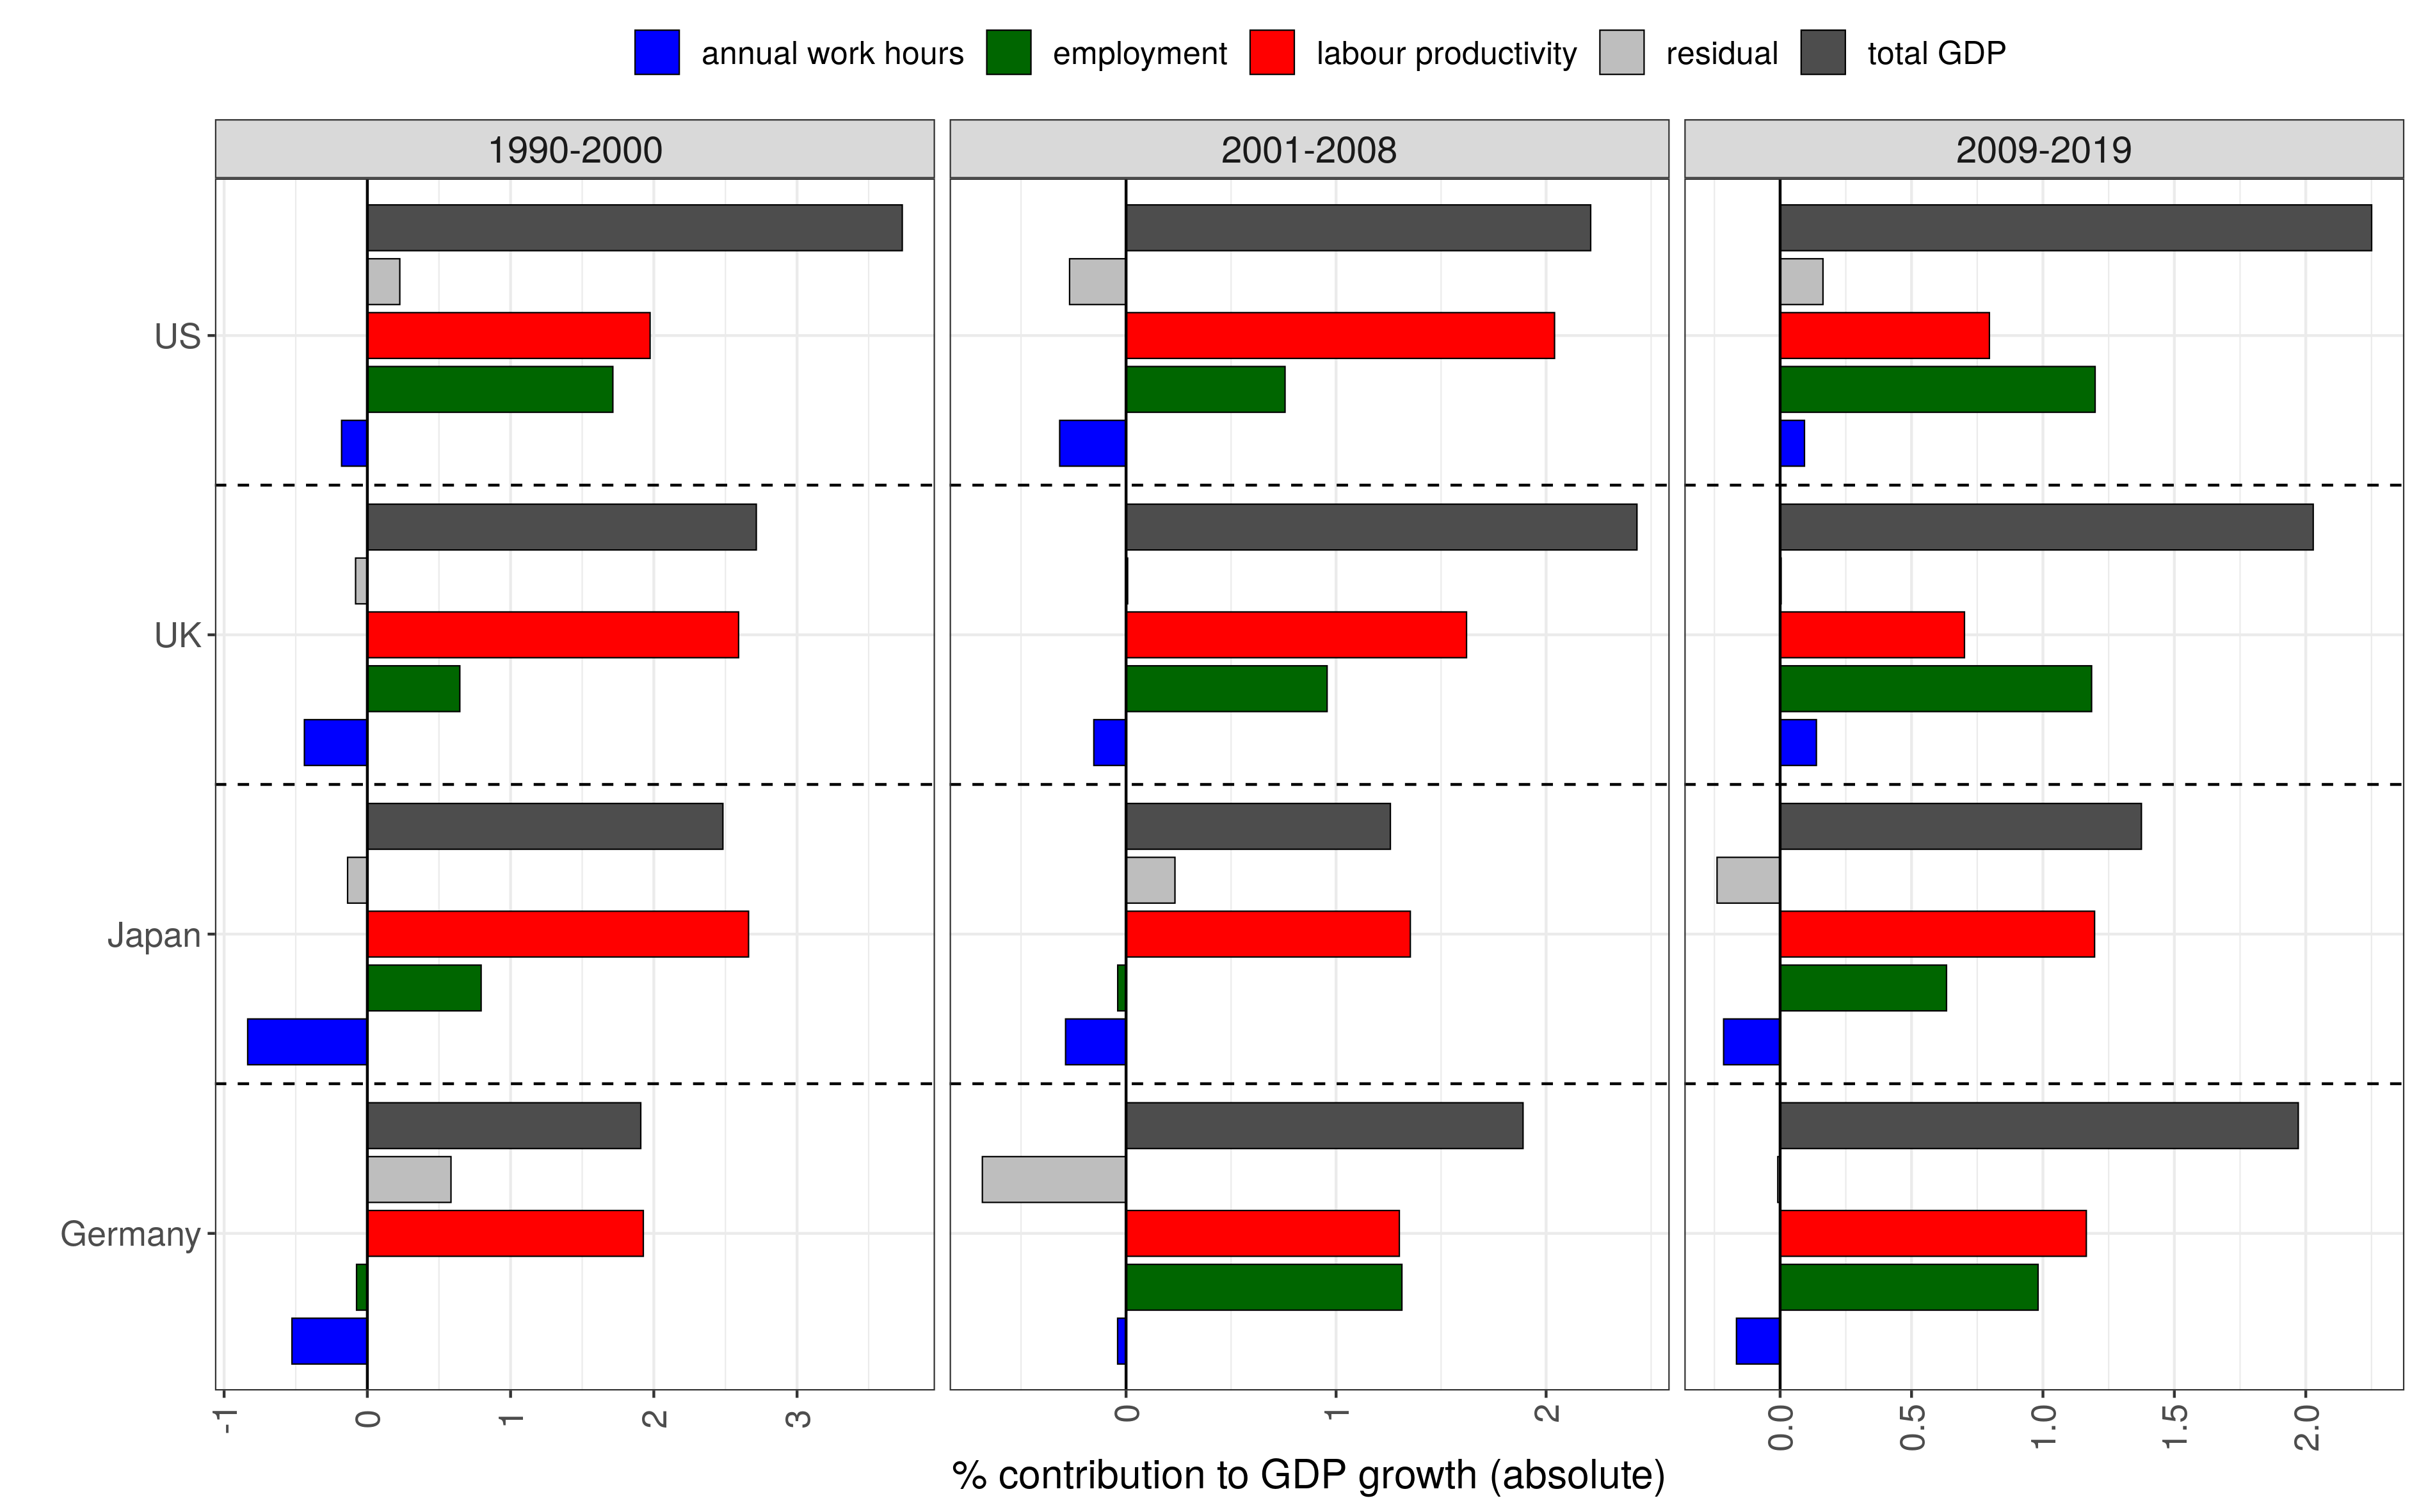
Annual work hours had a negative effect on growth in all three periods in Germany and Japan, because the number of hours people work fell. While this was also true in the US and UK before the financial crisis, since 2009 work hours had a small positive contribution in these two countries. In Japan labour productivity was the leading source of growth in each period, whereas in Germany this was true before 2000, but since then growth in employment has been equally important. In the US and UK growth in employment had a larger and growing share in economic growth and it became the main source of it following the financial crisis, surpassing labour productivity, which had the weakest growth in the UK.
Let’s again plot the relative share of these components in GDP growth as well:
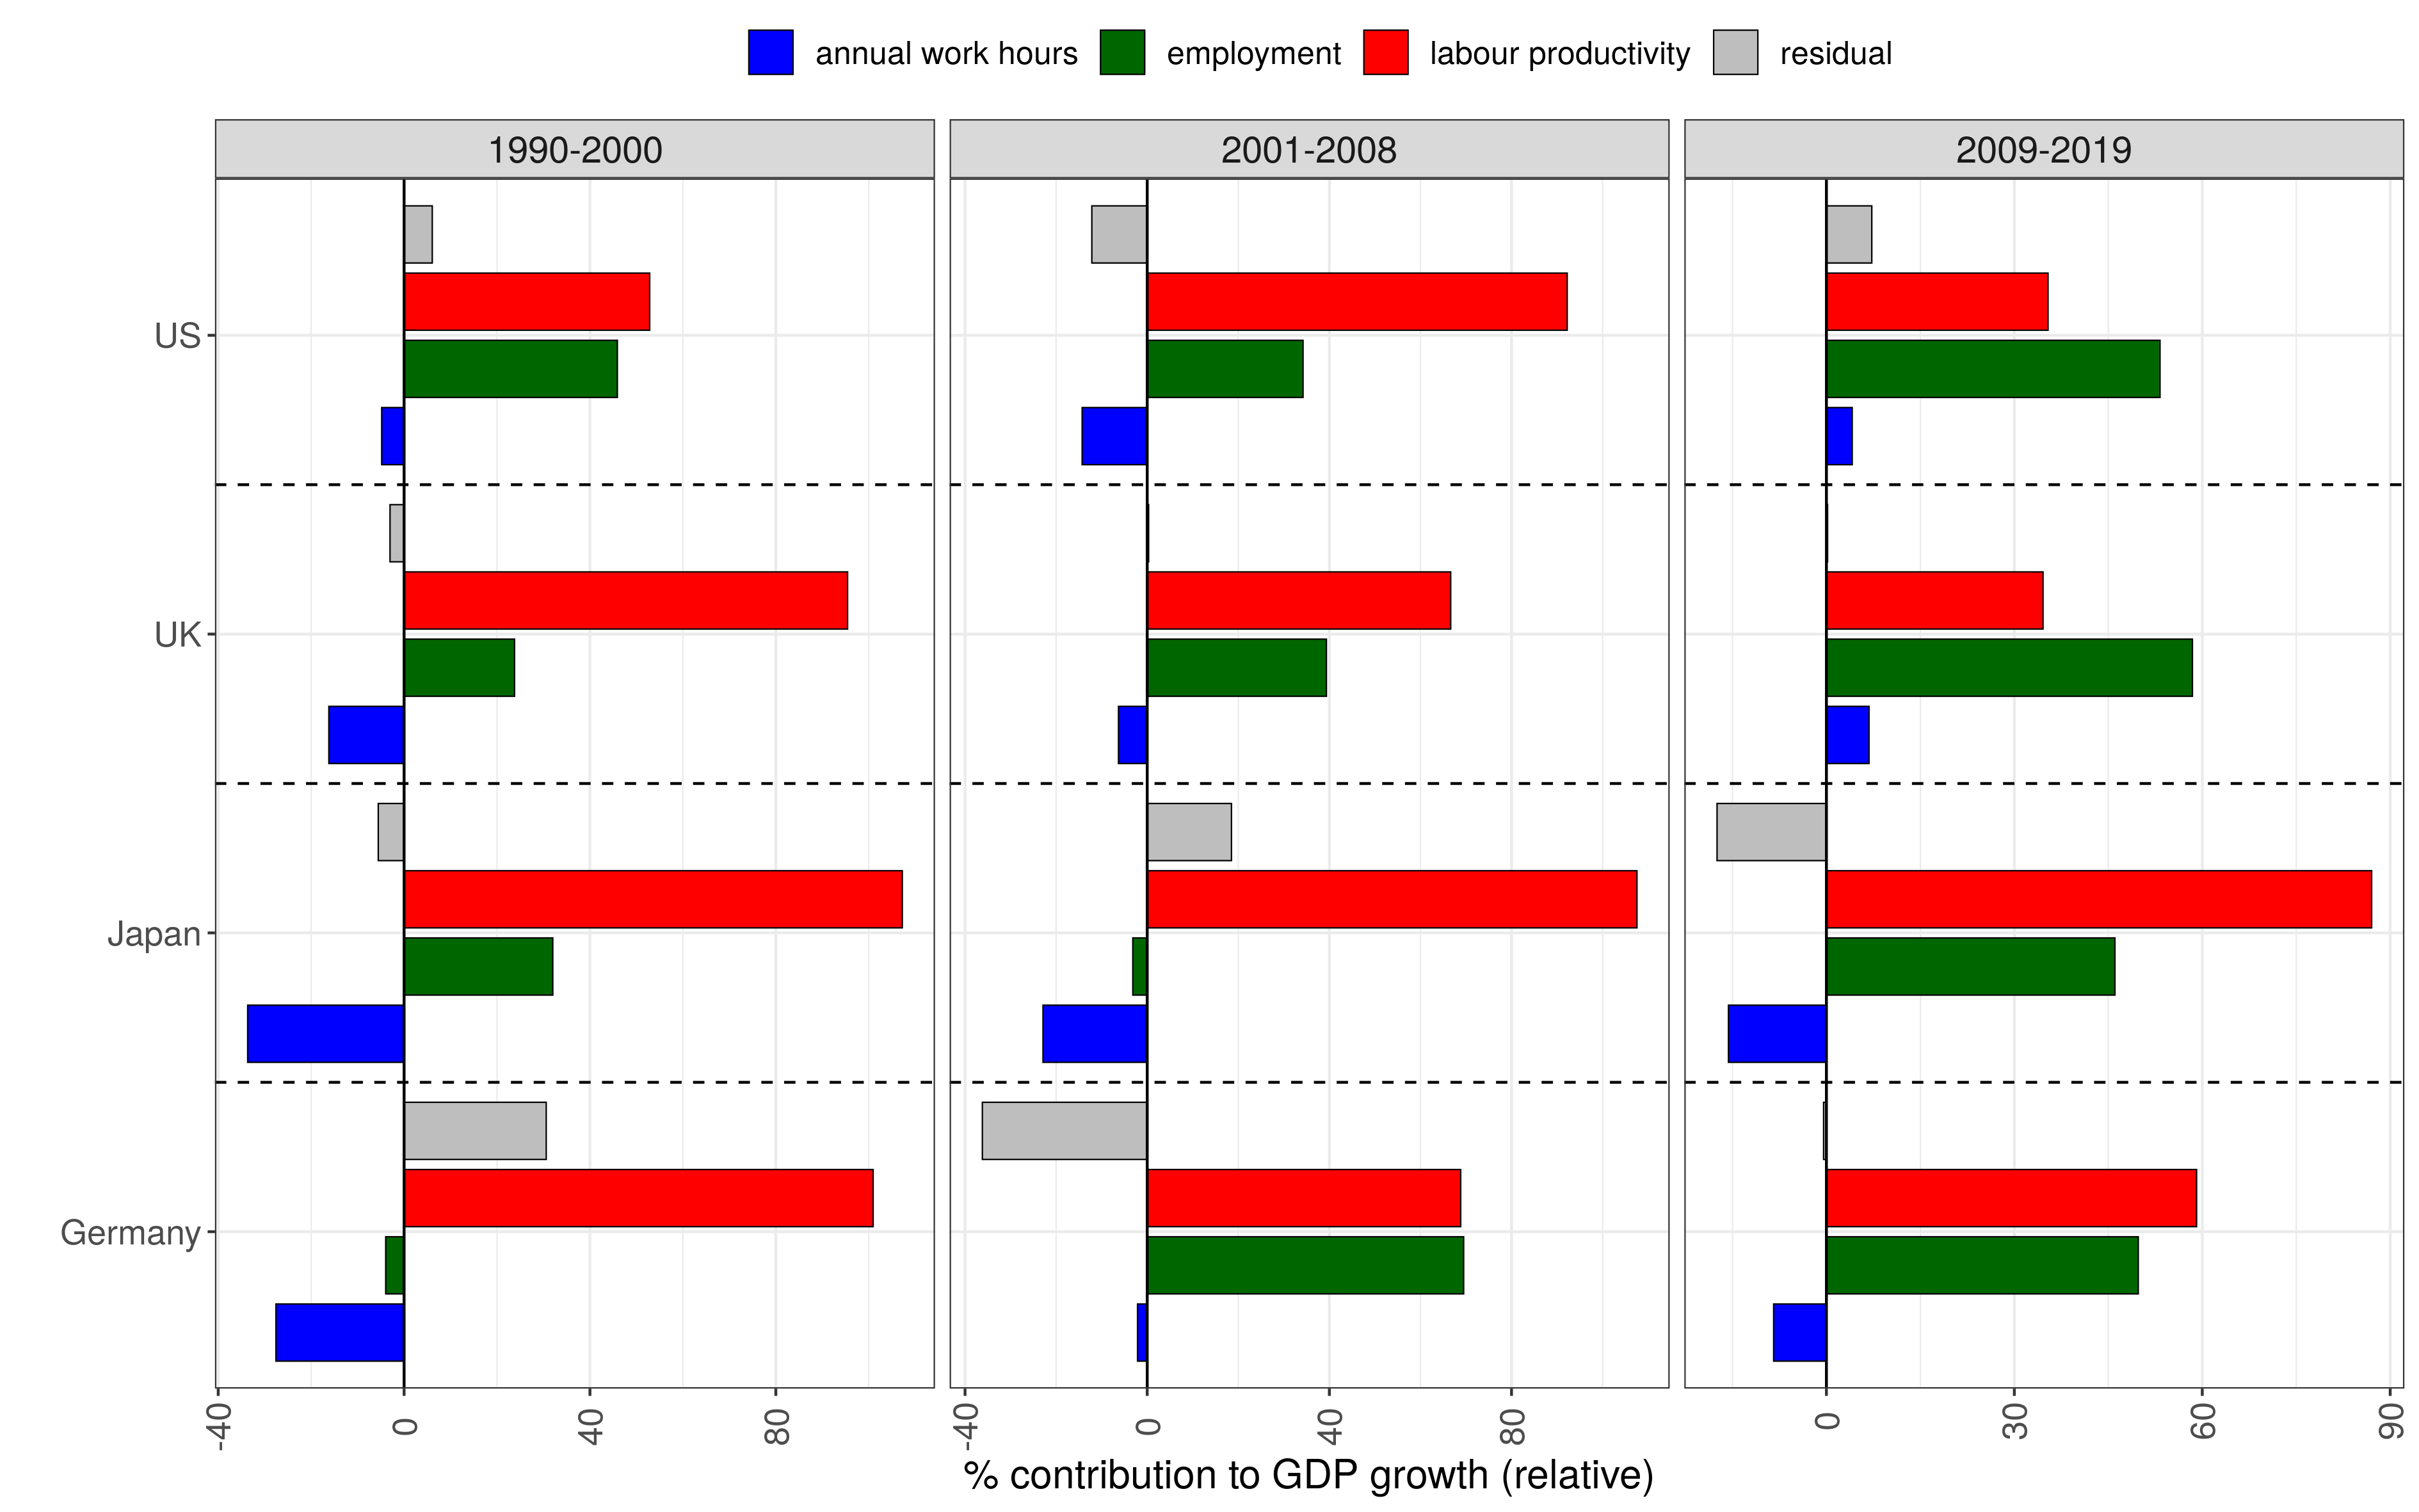
In summary, approximately 60% of economic growth in the UK post-2008 was due to more people at work, and not an increase in output per worker. The latter is arguably a better measure of wealth and technological progress.
In discussions of how to increase the rate of economic growth - if that is desirable and possible at all, something I did not discuss here - it would be helpful to separate its components as analysed above, not to mix up the expansion of the labour force (mainly due to immigration) with work actually becoming more productive.
Source code
Source code and data files for plots at Github repo.
political-economy globalization growth gdp